
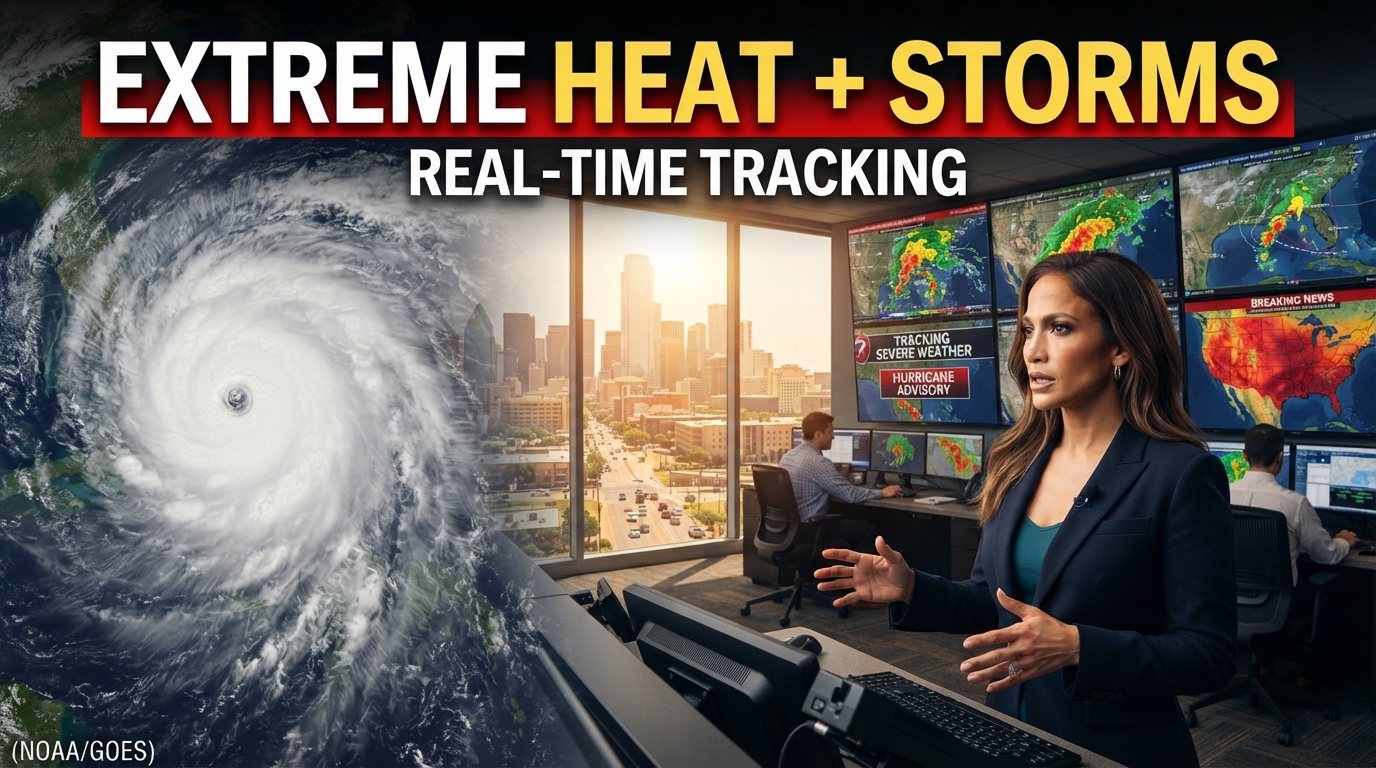
Real-Time Extreme Heat and Storm Tracking: The Ultimate Preparedness & Weather Monitoring Guide
Extreme heat and storm tracking has become an indispensable life-safety discipline as atmospheric emergencies increase in frequency and severity worldwide. From persistent heat domes locking regions in severe drought to rapid-onset tropical cyclones producing historic surge levels, modern meteorology offers actionable data to protect lives and property.
The good news: you don’t need a meteorology degree to use it. Modern extreme heat and storm tracking tools let anyone understand how global tracking networks operate, how to interpret meteorological alerts, and where to access verified data — allowing individuals and emergency management teams to turn early warnings into decisive action.
Also read:
Central Bank Rate Decisions & Market Volatility: Investor Guide
Atmospheric Pressure Cookers: Understanding Heat Domes
A heat dome represents one of the most hazardous persistent weather patterns in modern climatology. The phenomenon occurs when a strong, stagnant ridge of high atmospheric pressure traps warm air over a region — acting much like a tight lid on a pressure cooker. As the high pressure forces air toward the surface, the air compresses and heats exponentially, clearing cloud cover and allowing relentless solar radiation to bake the land day after day.
There’s no breeze. No clouds. Just heat, stacking up.
Primary Drivers of Heat Dome Formation
Rossby Wave Meanders: Severe atmospheric wave distortions cause the jet stream to slow down, locking high-pressure ridges (Omega blocks) into place for extended periods.
Soil-Moisture Feedback Loops: As intense heat evaporates ground moisture, the desiccated soil loses its evaporative cooling capacity, causing surface air to warm rapidly. Dry ground makes heat worse, and heat dries ground — a vicious loop.
Ocean-Atmospheric Thermal Anomalies: Elevated sea-surface temperatures transfer immense sensible heat and moisture into upper atmospheric layers, reinforcing the strength of high-pressure systems.
Prolonged heat domes severely compromise public health, elevate power grid failure risks due to surging cooling demand, and create powder-keg conditions for aggressive wildfires. Accurate extreme heat and storm tracking helps meteorologists evaluate these severe weather risks using Wet-Bulb Globe Temperature (WBGT) — an index incorporating ambient temperature, humidity, wind velocity, and solar angle to determine safe exposure thresholds for outdoor activity.
Tropical Cyclone Dynamics: Real-Time Tracking Systems
Tropical cyclones — classified as hurricanes in the Atlantic and East Pacific, typhoons in the Northwest Pacific, and severe cyclones in the Indian Ocean — are powerful thermodynamic engines fueled by sea-surface temperatures exceeding 26.5°C (80°F). Same machine, different name. Real-time extreme heat and storm tracking follows all three under one unified watch.
The Multi-Tiered Architecture of Storm Tracking
Modern extreme heat and storm tracking networks rely on integrated observation layers to capture real-time data from outer space down to the ocean surface:
Geostationary & Polar Satellite Networks: Systems like GOES-East, GOES-West, and Sentinel provide continuous multispectral imagery. Satellites record infrared cloud-top temperatures, monitor central eye organization, and track lightning flash density to detect rapid storm intensification.
Reconnaissance Aircraft (Hurricane Hunters): Specialized WP-3D Orion and WC-130J aircraft fly directly through eyewalls to release dropsondes. These instruments record barometric pressure, horizontal wind fields, temperature, and humidity directly at sea level.
Doppler Radar Arrays: Ground-based coastal radar systems (such as NEXRAD) provide high-resolution radial velocity and precipitation maps once storms move within 200–300 miles of shore, tracking tornadic vortex signatures embedded within rainbands.
Numerical Weather Prediction (NWP) Models: Global numerical engines — including the American GFS, the European ECMWF, and ensemble models — process trillions of calculations to predict potential trajectory cones and intensity shifts up to two weeks ahead.
Deconstructing the “Cone of Uncertainty”
The forecast cone issued by agencies like the National Hurricane Center displays the probable track of a tropical cyclone’s center point over a 5-day period. Historically, the storm’s core remains inside the boundary approximately 60% to 70% of the time. Here’s what people miss: hazards such as damaging inland winds, extreme flooding, and storm surge often extend tens or hundreds of miles outside the visual cone boundaries. Don’t fixate on the line — respect the whole system. That’s the golden rule of extreme heat and storm tracking.
Localized Severe Weather Alerts: Decoding Warnings
When severe convective storms spark localized tornadoes, straight-line microbursts, or torrential flash floods, extreme heat and storm tracking alerts use a specific warning vocabulary — understanding that terminology is vital for taking swift action. The scale escalates fast:
Advisory: Hazardous conditions are occurring, imminent, or expected, but present low risk to life if caution is taken. Stay updated; adjust outdoor schedules and travel routines.
Watch: Environmental conditions are favorable for hazardous weather to develop within or near the region. Prepare emergency supplies; review shelter plans and evacuation routes.
Warning: Severe, hazardous weather is actively occurring or imminent, posing an immediate danger to life. Move immediately to safe shelter (e.g., storm cellar or interior room).
Emergency: An exceptionally rare alert reserved for catastrophic, life-threatening severe weather events. Execute survival protocols instantly; monitor emergency broadcasts continuously.
Technological Advances in Weather Monitoring
Recent innovations have transformed extreme heat and storm tracking and how emergency agencies analyze multi-hazard atmospheric events:
Dual-Polarization Radar: Enables meteorologists to differentiate between rain, hail, snow, and airborne debris (such as tornadic debris ball signatures), providing clear confirmation of touchdown events in low-visibility conditions.
Space-Borne Synthetic Aperture Radar (SAR): Penetrates dense cloud structures to map ocean surface wind vectors and coastal flooding dynamics from space during hurricane landfalls.
AI-Driven Ensemble Forecasting: Artificial intelligence models now synthesize decades of historical weather data alongside physics-based prediction algorithms, drastically reducing computational runtime and improving extreme heat and storm tracking accuracy over 3- to 7-day lead times.
Verified Resources & Official News Links
For accurate operational alerts and authoritative updates on extreme heat and storm tracking, access these official global portals:
NOAA National Hurricane Center (NHC): Official tropical storm forecasts, advisories, hurricane tracking charts, and storm surge threat maps for Atlantic and Pacific Basins.
World Meteorological Organization (WMO) Severe Weather Hub: The international body aggregating official national weather warnings from worldwide hydrological and meteorological institutes.
NOAA NESDIS Real-Time Satellite & Hurricane Monitoring: Live high-resolution satellite imagery feeds tracking operational hurricanes and typhoons across global oceans.
WMO & WHO Global Heat Health Information Network: Authoritative guidance on managing heat stress, extreme heat early warnings, and urban heat mitigation.
NOAA Historical Hurricane Tracks Database: An interactive analytical tool mapping historical storm tracks, landfall locations, and hurricane intensity metrics dating back 150 years.
Frequently Asked Questions (FAQs)
What atmospheric mechanisms cause heat domes to stall over geographical regions?
Heat domes stall when planetary atmospheric wave patterns, such as the jet stream, form stationary high-amplitude blocking structures known as Omega blocks or cutoff highs. These static pressure systems deflect incoming storm tracks, locking sinking, warming air over a single geographical region for days or weeks. Nothing pushes them along, so they just sit there.
How do meteorological agencies calculate hurricane intensity before landfall occurs?
It’s a data fusion job at the heart of extreme heat and storm tracking. Forecast agencies integrate real-time data from satellite microwave sounders, coastal ocean buoys measuring surface barometric pressure, dropsondes deployed by reconnaissance aircraft into storm cores, and Doppler radar wind velocity algorithms. No single instrument tells the story — the picture emerges from all of them together.
What is the exact difference between a hurricane, a typhoon, and a cyclone?
None, physically. Hurricanes, typhoons, and cyclones are identical weather phenomena: violent tropical systems generating sustained winds exceeding 74 mph (119 km/h). Terminology varies strictly by geographic region: hurricanes develop in the North Atlantic and Eastern Pacific, typhoons form in the Northwest Pacific, and cyclones occur in the South Pacific and Indian Ocean.
Why is flash flooding considered one of the most deadly severe weather threats?
Speed — and this is where extreme heat and storm tracking saves lives. Flash floods materialize within minutes or hours of extreme rainfall, generating high-velocity water movement capable of sweeping away heavy vehicles, destabilizing structural foundations, and submerging low-lying areas before traditional evacuation orders can be effectively communicated. People underestimate water constantly — it takes far less than you’d think to lose a car.
How far in advance can meteorologists predict severe heat dome events?
Using modern numerical weather prediction models and atmospheric wave analysis, extreme heat and storm tracking systems can identify heat dome development, jet stream deceleration, and persistent high-pressure ridges between 7 and 14 days prior to event onset. That’s a real warning window — use it.
Effective extreme heat and storm tracking bridges advanced atmospheric science and proactive community protection. By utilizing official meteorological feeds, monitoring real-time radar networks, and recognizing the operational differences between weather watches and warnings, individuals and municipalities can make informed, life-saving decisions when extreme weather strikes.
1 thought on “Extreme Heat and Storm Tracking: Real-Time Monitoring & Safety Guide”